Text User Interface (TUI)
The Text User Interface of Exosphere provides a visual, interactive way of accessing the information gathered by Exosphere across your hosts.
It is a modal interface comprised of several screens you can toggle between, and allows you perform actions such as:
Viewing the status of all hosts in a Dashboard
Viewing the inventory status and drilling down into host details
Performing actions such as refreshing updates, pinging hosts, etc.
Viewing runtime logs in a nice colored panel.
While the TUI does not provide all the features of the CLI, it is often more convenient for overviews and at-a-glance status checks. It can also easily be used in conjunction with the Command Line Interface (CLI) for more advanced operations.
Launching the UI
You can launch the UI by running:
$ exosphere ui start
Or, from interactive mode:
exosphere> ui start
Tip
Launching the UI from interactive mode will allow you to return to the CLI when exiting the UI, making it possible to switch back and forth between the two interfaces seamlessly.
Interface Navigation
The UI is divided into several screens, each accessible via a keybind. At the very top of the screen, you will see the title bar with the current screen name.
The UI is separated in three main screens:
Dashboard: A grid view of all hosts, showing their online status.
Inventory: A detailed view of all hosts and their updates.
Logs: A real-time view of the logs generated by Exosphere.
The bottom of the screen contains a status bar with keybinds for navigation and actions.
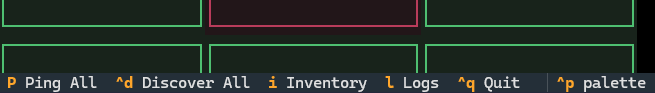
Some of the keys displayed there will show up globally, while others are specific to the current screen you are on.
For instance here, you can press i to go to the Inventory screen.
Keys are shown as they should be typed, so shift+p will trigger Ping All,
and ctrl+d will trigger Discover All.
Universally, in every screen, you can press ctrl+p to access the command
palette, which you can use to show more detailed help, change the display theme,
or perform other miscellaneous actions.
On Any Screen, you can press ctrl+q to Quit the UI.
Executing Operations
Most if not all of the operations you can perform on hosts in the UI are going to be dispatched through the same parallelized Thread Pool as the CLI, with minor implementation differences.
The UI will present a modal progress bar whenever this is occurring:
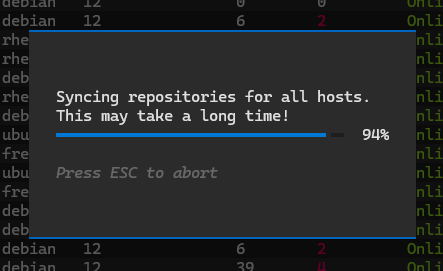
Note
While you can press ESC to cancel the operation, it will not abort already executing tasks in the Thread Pool, only prevent new tasks from being started past this point.
The Dashboard
The default screen Exosphere launches into is the Dashboard. It presents a colored grid, each square representing a host in your inventory.
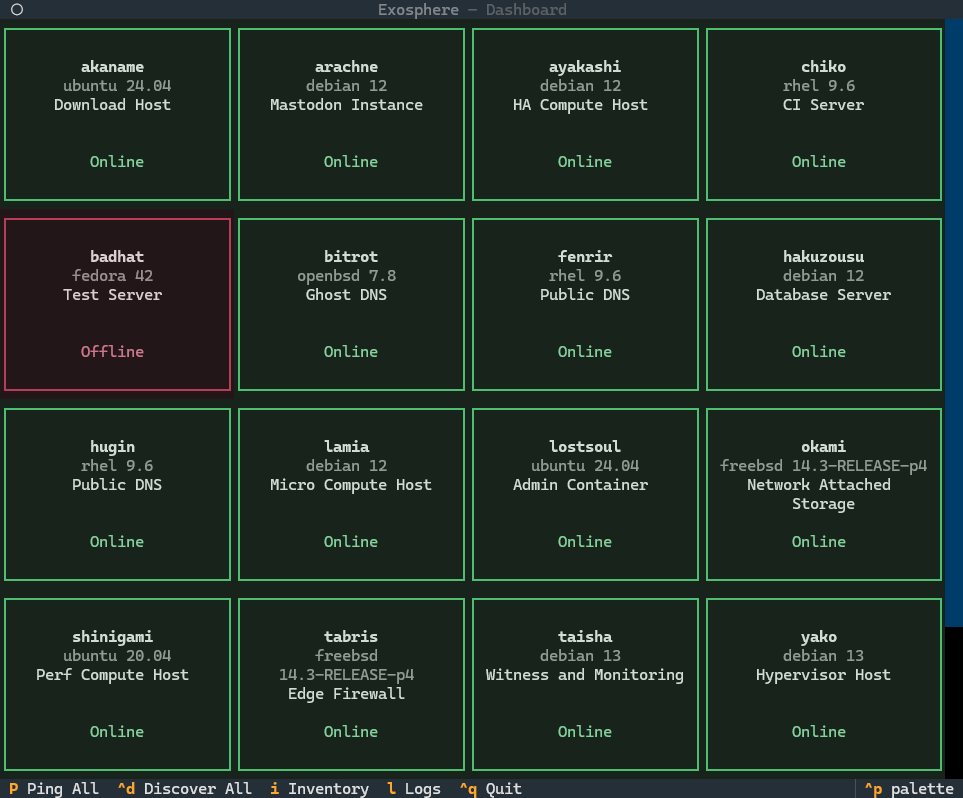
Each square is color coded according to the status of the host. Green for Online, Red for Offline. Basic information about each host is also displayed.
This view is mostly useful as a poor man’s monitoring dashboard, allowing you to quickly see which hosts are online or offline at a glance.
The following operations can be performed from the Dashboard:
Ping All: Press shift+p to ping all hosts and update their status.
Discover All: Press ctrl+d to discover all hosts and update their platform information.
Inventory Screen
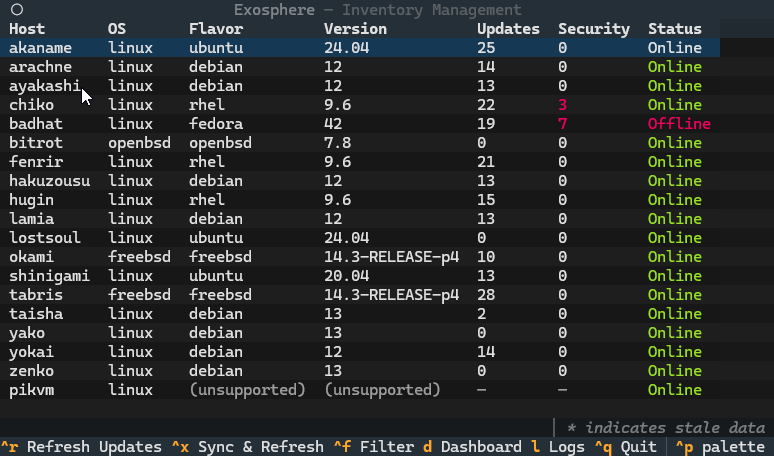
The Inventory screen provides a detailed view of all the hosts in your inventory.
The following operations can be performed from the Inventory screen:
Refresh Updates: Press ctrl+r to refresh the updates for all hosts.
Sync & Refresh: Press ctrl+x to sync the repositories and refresh updates for all hosts.
Note
Syncing repositories may take a long time depending on inventory size and host specifications.
It functions almost identically to the inventory status command in the CLI,
but it allows you to navigate the rows with the Arrow Keys.
You can select a host with Enter, which will open a panel with more details:
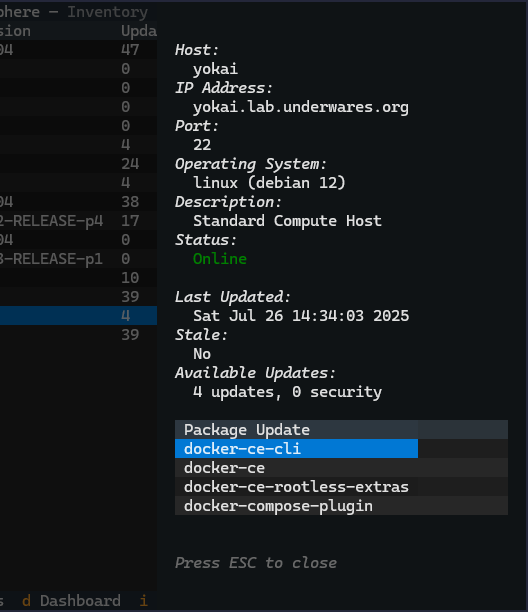
Any available updates will be displayed in a list. You can navigate this list with the
arrow keys, much like the inventory itself, and select any of them with Enter.
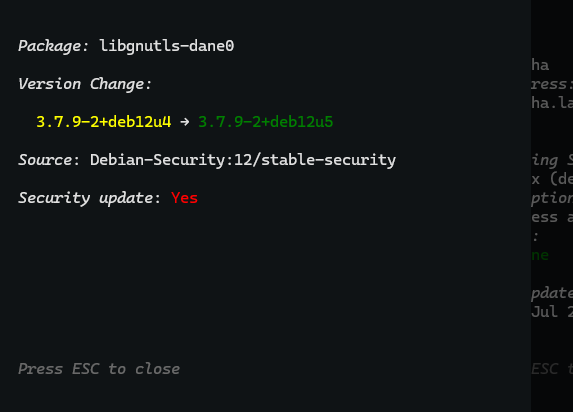
Details about the currently selected update will be displayed in a new panel. This includes the package name, source, version change and whether or not it is a security update.
Filtering Hosts
It is also possible to filter hosts with ctrl+f, which will open a prompt with the available filters.
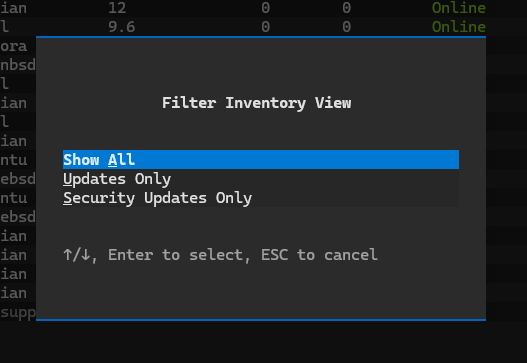
After selecting a filter, only hosts matching the criteria will be displayed. The active filter will be shown in the status bar at the bottom of the screen:
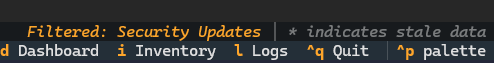
You can clear the filter by pressing ctrl+f again and selecting the “Show All” option.
Logs Screen
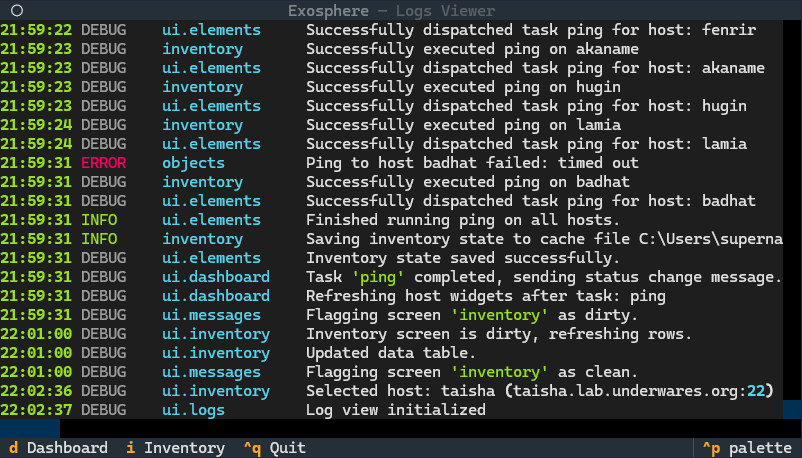
The Logs screen provides a real-time view of the logs generated by Exosphere.
You can access it by pressing l from the Dashboard or Inventory screen.
The window can be scrolled left and right, and will color certain elements.
Tip
The logs are always written to file. You can access them at the
path returned by the exosphere config paths command.